NYR Team Metrics: Better, But Not Good
Note: Metrics do not include 12/26 vs. NYI
Since our last numbers update the Rangers have continued to find good results, going 6-2-1 in their lead up to the Christmas holiday. To summarize, the club continues to "find" ways to win with very good shooting (much of which is luck driven) and Vezina-esque goaltending (this is going to be Henrik Lunqvist's peak season in the NHL if this continues, most likely). This is still not very good news, but the overall good news since the early-December update is that the team is playing (aka outplaying opponents) better than when the season started. I know the great George has game-by-game Fenwick numbers that he can chime in with below, but for now lets take a peak at some charts (after the jump: how the Rangers are being used and I show you NYR's version of behindthetnet's Christmas present to the advanced stats community).
Oh and P.S: Dubinsky shot the puck and it went in! Amazing.
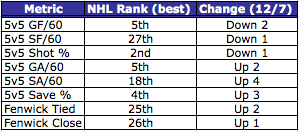
These are all good changes in a two/two and a half-week period. The Rangers are letting fewer shots get on net, while also improving their Fenwick numbers. For those who are curious as to what Fenwick is:
The easiest way to explain what the Fenwick number is to use Corsi, which was its oringal base:
Corsi # = shots on net, missed shots, and blocked shots (aka all shots taken)
Fenwick # = shots on net and missed shots (aka credits defense for blocking shots)
So if everything is getting better why is it still not good, as I said in the title? Below is the Christmas present from Gabe Desjardins, NYR edition. It shows the 5v5 shot ratio and subsequent PDO (team shot % + team save %) in a game-by-game fashion. If you click on the link above, you can also go through each NYR game this season and see how the shots (and goals) progress through a game (probably the best gift I didn't ask for this Christmas). Below is NYR's chart:
As we can see, NYR out-goals their opponents but does not out-shoot them. While this explains partly why they're winning games, how likely is this all to continue? Luckily, as we've discussed, the club is getting better at shooting, as we can see with the steady climb since game 10. But, as there always has to be a but, they're still below the magic 50% line; where true Stanley Cup contenders rarely, if at all, go under.
This is where the tandem of Lundqvist/Biron have saved the Rangers all season - which explains why the PDO on the right is so high. This is generally not good, because PDO always regresses (either up or down) over time to 100% (aka 1) mark and represents a lot of the luck that goes into scoring a goal and receiving Vezina-esque goaltending all-season long (extremely hard to do). Don't get me wrong, as good teams will have high PDO's (usually because they get good goaltending), but truly good teams (aka Stanley Cup winners) also dominate when it comes the Shot Ratio graph and the similar Fenwick/Corsi numbers.
So what does it all mean? The Rangers are on the right track, which is great, but at the same time the Rangers have some work to do on the ice to become a real cup-contender in the coming months.
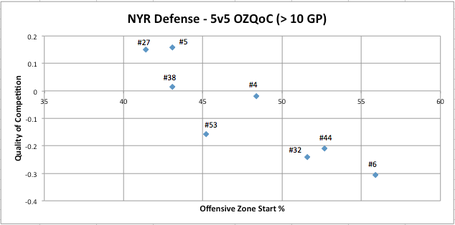
Here's how the Rangers are being used at 5v5 (as of 12/25). Refer to this article here if you're confused:
Carl Hagelin is playing a very adult role as a kid. Gotta love these late-round dandy Swedes. Nothing too much else to report on besides to confirm Rupps bottom-six usage.
Regardless of points Michael Del Zotto has bounced back well from a tough year last season. Also note Stralman essentially replaces the injured Eminger and Stu Bickel would be at 50%/-0.634 in his three games before Christmas.
So that's it. Let me know what you guys think and if there are any questions. Also I highly suggest you go through the NYR games and look at some other teams Shot Differential charts from above. Fantasy Hockey/Betting tip: if St. Louis gets decent goaltending they are an elite team -- as a fan I have no shame they whipped NYR at home (even if NYR is better on the road this year).


